
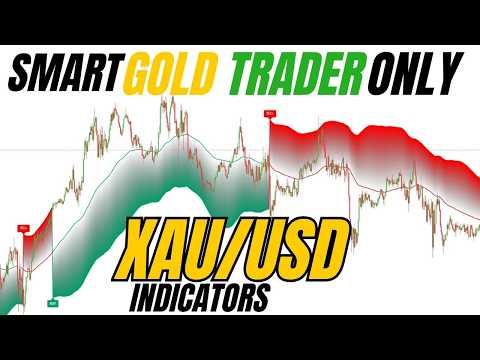
Gold Trading Strategy Using RSI and Trend Indicators
Trading gold requires clear entry and exit signals to manage positions effectively. This guide explores three indicator-based approaches for the XAUUSD pair on the 15-minute timeframe, each using different technical tools to identify potential sell opportunities.
Key takeaways
- All three strategies use the 15-minute timeframe for gold trading
- RSI Trade Navigator uses red highlights and red candles to signal sell entries
- Kelvin Trend Label generates down arrows with red candles for sell signals
- Volatility Weighted Cloud uses pink candles to confirm down signals
- Stop losses are placed at previous highs or indicator levels
Setting Up the Chart
Begin by opening the gold (XAUUSD) pair on the 15-minute timeframe. This shorter timeframe allows traders to monitor intraday price movements and react to signals as they develop.
The strategies discussed here focus on sell trade setups using technical indicators with adjusted settings. Each indicator provides different visual cues for entry confirmation.
Strategy 1: RSI Trade Navigator
The RSI Trade Navigator indicator requires specific settings adjustments. The sell signal is confirmed when the market trades below the RSI Trade Navigator indicator line and displays both a red highlighter and a red candle.
Once these conditions align, a sell position can be opened. The stop loss should be placed at the previous high level, while the take profit target is set at a 1:1 risk to reward ratio.
Strategy 2: Kelvin Trend Label
The Kelvin Trend Label indicator also uses adjusted settings for gold trading. This indicator generates a down red arrow signal accompanied by a red candle to confirm a sell opportunity.
Entry occurs once the red arrow and red candle signal appear together. The stop loss is placed at the Calman straight level indicated by the tool. The take profit target for this strategy is 1:1.5 risk to reward ratio.
Strategy 3: Volatility Weighted Cloud
The Volatility Weighted Cloud indicator requires settings adjustments before use. A sell signal is confirmed when the indicator generates a down signal along with a pink candle.
Traders can open a sell position when the pink candle signal is confirmed. The stop loss should be placed at the previous swing high, and the take profit target is set at 1:1.5 risk to reward ratio.
Risk Management Considerations
Each strategy includes specific stop loss placement rules. The RSI Trade Navigator uses the previous high, the Kelvin Trend Label references the Calman straight level, and the Volatility Weighted Cloud uses the previous swing high.
The risk to reward ratios vary between strategies, with the RSI approach targeting 1:1 and the other two targeting 1:1.5. These ratios help define the relationship between potential loss and potential gain on each trade.
Frequently asked questions
What timeframe is used for these gold trading strategies?
All three strategies use the 15-minute timeframe for trading gold (XAUUSD).
Where should stop losses be placed with the RSI Trade Navigator strategy?
The stop loss should be set at the previous high when using the RSI Trade Navigator indicator.
What confirms a sell signal with the Kelvin Trend Label indicator?
A sell signal is confirmed when the Kelvin Trend Label generates a down red arrow signal accompanied by a red candle.
What is the target risk to reward ratio for the Volatility Weighted Cloud strategy?
The Volatility Weighted Cloud strategy targets a 1:1.5 risk to reward ratio.
Watch on YouTube: Watch the full video on the ForexLia YouTube channel
Full video transcript
Hello traders. Welcome back. Today, I am going to share you only gold indicator strategy. So, watch video till the end. First, open the gold pair on the 15-minute time frame.
For this strategy, we will use the RSI trade navigator indicator. And we will adjust some of its setting. Sell trade rules when the market is below the RSI trade navigator indicator. And we see a red highlighter and a red candle. This is a sell signal confirmation.
This is a sell signal confirmation. Now, we take a sell trade. Stop loss, set it at the previous high. Take profit, set it at 1:1 risk to reward. As you can see, we want this straight.
indicator Kelvin Trend Label with adjusted settings. Sell trade rules. A sell signal is confirmed when the Kelvin's Trend Label generates a down red arrow signal accompanied by a red candle. >> Entry open a sale position once the red arrow with red candle signal is confirmed. Stop loss.
Place it at the Calman straight level. Take profit. Target a 1:1.5 risk to reward ratio. As you can see, the price hits our target for a successful trade. Indicator volatility weighted cloud.
>> With adjusted settings, sell trade rules. A sell signal is confirmed when the volatility weighted cloud generates a down signal accompanied by a pink candle. >> Entry, open a sell position once the pink candle signal is confirmed. Stop loss, place it at the previous swing high. Take profit target of 1 is to 1.5 risk to reward ratio.
>> As you can see, the price hit our target for a successful trade.
Share This Blog