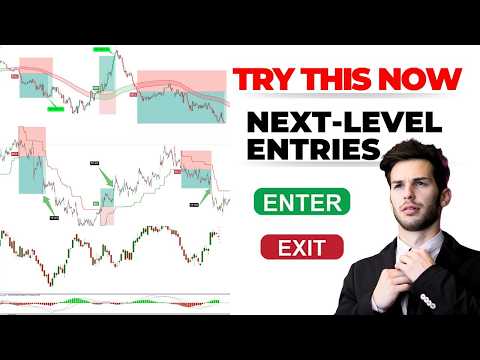
This article covers three TradingView indicators that traders use to identify potential entry signals: the Trade Craft ICT indicator, the Volume Flow Index, and the KS Extreme Duration indicator. Each indicator offers different visual signals that traders can incorporate into their chart analysis.
Key takeaways
- The Trade Craft ICT indicator uses color-coded highlights and lines to signal potential sell entries when the market is below the indicator
- The Volume Flow Index uses a cloud and zero-level crossover to signal potential buy entries when the green cloud crosses above zero
- The KS Extreme Duration indicator displays arrow signals—green for potential buy entries and red for potential sell entries
- Stop loss placement is typically set at the previous high for sells and previous low for buys
- Take profit targets mentioned include 1:1.5 and 1:1 risk-to-reward ratios
Trade Craft ICT Indicator Signals
The Trade Craft ICT indicator is a custom TradingView tool that provides visual signals through color-coded elements. The indicator displays highlights, lines, and relates to candlestick colors to identify potential trading opportunities.
For sell signals, traders look for the market to be positioned below the Trade Craft ICT indicator. When a red highlighter appears along with a red line and red candle, this combination forms what traders consider a sell signal confirmation. The stop loss is placed at the previous high point, and the take profit target is set at a 1:1.5 risk-to-reward ratio.
Volume Flow Index Indicator Setup
The Volume Flow Index indicator visualizes volume data through a cloud formation and a zero reference level. Traders using this indicator focus on the relationship between the green cloud and the zero line, along with the direction of the indicator line.
A buy signal confirmation occurs when the Volume Flow Index indicator's green cloud crosses above the zero level and the line moves in an upward direction. When this pattern appears, traders place a stop loss at the previous low point. The take profit target for this setup is set at a 1:1 risk-to-reward ratio.
KS Extreme Duration Indicator Arrows
The KS Extreme Duration indicator provides straightforward arrow signals directly on the chart. This indicator generates two types of arrows to indicate potential trading opportunities.
A green arrow from the KS Extreme Duration indicator signals a potential buy entry, while a red arrow indicates a potential sell entry. For buy signals, the stop loss is positioned at the previous low point, and the take profit target is set at a 1:1 risk-to-reward ratio. The arrow-based system offers a simple visual reference for entry timing.
Combining Indicators on TradingView
TradingView allows traders to add multiple custom indicators to a single chart. The three indicators discussed—Trade Craft ICT, Volume Flow Index, and KS Extreme Duration—can be used individually or in combination depending on a trader's analysis approach.
Each indicator requires specific settings adjustments within TradingView to function as described. Traders should familiarize themselves with the configuration options for each indicator to ensure the signals appear as intended on their charts.
Frequently asked questions
What signals does the Trade Craft ICT indicator provide for sell entries?
The Trade Craft ICT indicator signals a potential sell entry when the market is below the indicator and you see a red highlighter, red line, and red candle together. The stop loss is set at the previous high, and take profit at a 1:1.5 risk-to-reward ratio.
How does the Volume Flow Index indicator generate buy signals?
The Volume Flow Index generates a buy signal when its green cloud crosses above the zero level and the line moves upward. The stop loss is placed at the previous low point, with a take profit target at 1:1 risk-to-reward.
What do the arrows on the KS Extreme Duration indicator mean?
The KS Extreme Duration indicator displays green arrows for potential buy entries and red arrows for potential sell entries. For buy signals, the stop loss is set at the previous low with a take profit target at 1:1 risk-to-reward ratio.
Can these indicators be used on the TradingView platform?
Yes, all three indicators—Trade Craft ICT, Volume Flow Index, and KS Extreme Duration—are custom indicators available for TradingView. They require specific settings adjustments to display the signals described.
Watch on YouTube: Watch the full video on the ForexLia YouTube channel
Full video transcript
Welcome back traders. Today I'm going to show you top three most powerful indicators. For this strategy, we will use the Trade Craft ICT indicator. And we will adjust some of its setting. Sell trade rules.
When the market is below the Trade Craft ICT indicator, and we see a red highlighter, red line, and red candle, this is a sell signal confirmation. Now, we take a sell trade. This is a sell signal confirmation. Stop loss, set it at the previous high. Take profit, set it at 1:1.5 [music] risk to reward.
>> As you can see, we won this trade. This strategy we need the volume flow index indicator. If the volume flow index indicator's green cloud crosses the zero level and the line moves upward, then we take a buy trade. Here is the buy signal confirmation. We take a buy trade here.
Set the stop loss at the previous low point and set the profit target at 1 to 1. We won this trade. KS extreme duration indicator. If the KS extreme duration indicator gives a green arrow, then we take a buy trade. If the case extreme duration indicator gives a red arrow, then we take a sell trade.
Here is a buy signal confirmation. We place a buy trade here, take a stop loss, and set the profit target at 1:1. We won this trade. >> If you like [music] my strategy, please like this video and subscribe to my YouTube channel.