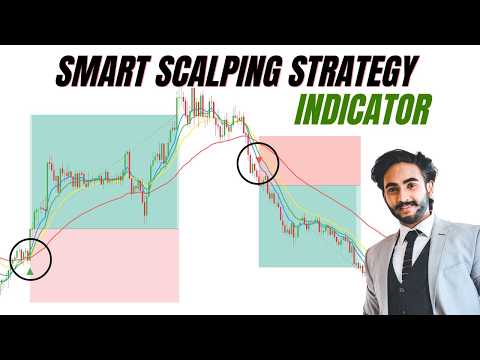
TradingView Buy Sell Signal Indicator Guide for Scalping
Trend-following indicators can help traders identify potential entry points in the market. This guide explains how to use the Jack Spinner indicator on TradingView to spot buy and sell signals on shorter timeframes.
Key takeaways
- The Jack Spinner indicator generates red arrows for sell signals and green arrows for buy signals
- Stop loss is placed at the previous high for sells and previous low for buys
- The strategy uses a 1:1.5 risk-reward ratio as the profit target
- New signals that appear while an active trade is running should not be considered valid
- The example demonstration uses GBPUSD on a 5-minute timeframe
Understanding the Jack Spinner Indicator
The Jack Spinner indicator is a trend-following tool available on TradingView. It generates visual signals in the form of colored arrows that appear on the price chart.
Red arrows indicate potential sell opportunities, while green arrows suggest potential buy opportunities. These signals are designed to help traders identify when the market may be moving in a particular direction.
The example in this strategy uses the GBPUSD currency pair on a 5-minute timeframe, making it suitable for scalping approaches where trades are held for shorter durations.
Sell Trade Setup Rules
A sell signal is confirmed when the market is below the Jack Spinner indicator and a red arrow appears on the chart. This combination suggests a potential downward movement.
When entering a sell trade, the stop loss is placed at the previous high point on the chart. This level represents a logical place where the trade idea would be invalidated if price moves against the position.
The profit target for sell trades is set at a 1:1.5 risk-reward ratio. This means if the stop loss distance is 10 pips, the profit target would be 15 pips.
Buy Trade Setup Rules
A buy signal is confirmed when the market is above the Jack Spinner indicator and a green arrow appears on the chart. This combination suggests a potential upward movement.
For buy trades, the stop loss is placed at the previous low point on the chart. This serves as a reference level where the bullish outlook would be considered invalid.
The profit target for buy trades also follows the 1:1.5 risk-reward ratio, maintaining consistency with the sell setup approach.
Important Signal Filtering Rule
One key rule to follow is signal filtering during active trades. If you have entered a trade based on a signal and a new signal appears while that trade is still running, the new signal should not be considered valid.
This rule prevents overtrading and helps maintain discipline. It ensures you remain focused on the current trade rather than being distracted by every new arrow that appears on the chart.
Only after a trade is closed should you look for the next valid signal from the indicator.
Practical Application on the Chart
The video demonstrates several trade examples on the GBPUSD 5-minute chart. Each example shows the signal confirmation, entry point, stop loss placement, and profit target level.
The examples include both buy and sell scenarios, illustrating how the indicator works in different market conditions. The demonstration focuses on the mechanical application of the rules rather than predicting outcomes.
As with any trading approach, actual results will vary based on market conditions, execution, and individual trading decisions.
Frequently asked questions
What timeframe is used for this Jack Spinner indicator strategy?
The strategy is demonstrated on a 5-minute timeframe using the GBPUSD currency pair, making it suitable for scalping approaches.
How do I set the stop loss for buy and sell trades?
For sell trades, place the stop loss at the previous high point. For buy trades, place the stop loss at the previous low point on the chart.
What is the risk-reward ratio for this strategy?
The strategy uses a 1:1.5 risk-reward ratio for profit targets, meaning the target is 1.5 times the distance of the stop loss.
Should I take every signal that appears on the chart?
No. If you have an active trade running and a new signal appears, that intervening signal should not be considered valid. Only look for new signals after closing your current trade.
Watch on YouTube: Watch the full video on the ForexLia YouTube channel
Full video transcript
Hello traders, welcome to Forex here. Today, I'm going to teach you about a powerful trade following indicator that can help you better understand market trends. These indicators follow the direction of the trade and can be a very useful tool in your technical analysis. Many traders use such indicators to improve their decision-making process. First, open the GBP USD pair on the 5-minute time frame.
For this strategy, we will use Jack Spinner indicator. Sell trade rules. If market go this the Jack Spinner indicator with red arrow, this is sell signal confirmation. Here is sell signal confirmation. We place a sell here.
Set stop loss previous high point. Set profit target 1:1.5. >> As you can see we won this trade. Buy trade rules. If market above this the check spinner indicator with green arrow.
This is buy signal confirmation. Here is buy signal confirmation. We place a buy here. Set a stop loss previous low point. Set profit target 1:1.5.
Important point, if you have an active trade running based on a signal and a new signal is generated while that trade is still in progress that intervening signal will not be considered valid. As you can see we won this trade. Another sale example. Set stop loss previous high point. Set profit target 1:1.5.
As you can see, we won this trade. Here is buy signal confirmation. We place a buy here. Set stop loss previous low point. Set profit 1:1.5.
As you can see, we won this trade. This video is for education purpose only. If you like this strategy, please like, share, and subscribe to my channel. See you in the next strategy.
Share This Blog